4. Getting started
A note about downloadable files
In this and the following five chapters, we use a wide variety of real-world examples to illustrate how Sequedex can be visualized and understood as part of a broader work-flow. Not only are the analysis scripts useful templates for modification to meet the user’s own specific needs, but reference trees and figures, as well as the coallated output from a broad array of publically available data sets provide a useful context for comparing his or her own data. While links are always provided in the midst of the discussion, it is also possible to download this entire documentation package, with web-pages, figures, and downloadable files at https://media.readthedocs.org/htmlzip/sequedex/latest/sequedex.zip. This file will unpack into a directory sequedex-latest, with a subdirectory _downloads. If the user places the contents of (or renames) sequedex-latest/_downloads into Sequedex-docs/dl/ of the user’s home directory, most of the examples can simply be cut and pasted directly into the correct application in order to run. Otherwise, fairly straightforward changes will need to be made for many of the examples to account for the actual location of downloaded files.
4.1. Running Sequescan
Sequedex can be run in several modes with either a simple graphical user interface or directly from the command line. The platform-specific instructions for starting the graphical user interface and obtaining a license file were provided in the previous chapter, and a description of command line use of Sequedex is provided at the end of this chapter. If the license file is not obtained or installed incorrectly, Sequedex will process a limited number of reads (~10,000) and work only in single-thread mode. For the bulk of this chapter, we will assume the graphical user interface is being used, and that the user has some way of looking at the tab-delimited text output files, whether that be Excel, a text editor, or an analysis environment like R or Matlab.
Sequedex is distributed with several sets of test data in a tar archive or a zip file for demonstration and validation. In this chapter, we illustrate how to use Sequedex on these datasets. Two metagenomics data files are provided, one from a stool sample sequenced under the human microbiome program and two from a soil sample collected from a Maryland estuary. Also provided are synthetic data files constructed from the draft genomes of four novel organisms cultured from desert cyanobacterial mats, Bacillus mojavensis, Bosea thiooxidans, Herbaspirillum seropedicae, and Microbacterium trichotecenolyticum. The complete stool sample file can be obtained at http://www.ncbi.nlm.nih.gov/Traces/sra/?view=run_browser&run=SRR059346 and the Maryland estuary sample analysis can be compared to the analysis in Figure 7 of Berendzen, et al. [1] as well as additional files 5 and 6 of this work. The synthetic data sets were used in this same manuscript to explore the read-length dependence of Sequedex’s sensitivity and specificity, illustrated in Figure 6.
The test data set for the human microbiome sample is located in the unpacked archive directory testData/metagenomes/humanMicrobiome/gut/. If you are starting the Sequedex GUI from the command line, it may be easiest to navigate this directory before typing sequescan. Alternatively, you can start the sequescan GUI from the applications menu and navigate to the data directory with the dialog box. In either case, you should see a screen that looks like this when you have started analysis of the data set:
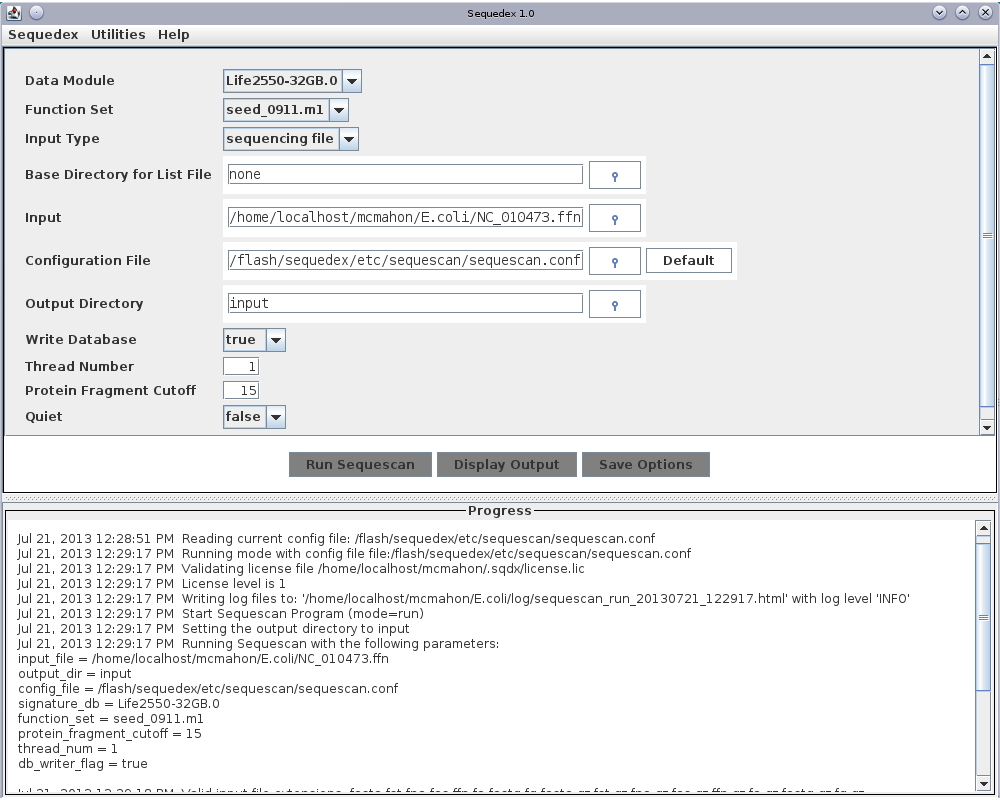
The graphical user interface for Sequescan. At the top are two pull-down menus that enable the user to request and install a license and to quit the program. Three input selections allow the user to choose the signature data module, the functional data module and select whether the fasta input files will be chosen by name, by directory, or by an input file listing the complete path of files to be analyzed. To learn more about memory usage, please read Alternative data modules and memory usage before proceeding. If the user chooses to use a file with a list of input files (which can be in multiple directories), the next input specifies the base directory for the filenames (defaults to the filesystem root). Below this, the ‘Input’ box is used to select a data file, data directory, or a text file listing data files to be analyzed, depending on ‘Input type’ selected above. A configuration file is selected to specify additional program options. The top-level directory to which output files will be written can be selected. Finally, the number of threads used and whether verbose output messages are desired can be selected. Note that at present multiple threads can only be used when multiple files are simultaneously analyzed; each file is assigned a thread.
Download the nucleotide sequence of the called genes in E. coli from the NCBI ftp site ( ftp://ftp.ncbi.nih.gov/genomes/Bacteria/Escherichia_coli_K_12_substr__DH10B_uid58979/NC_010473.ffn ). Click on the button to the right of the ‘input’ field and locate this file on your computer. After opening this file and clicking the ‘Run Sequescan’ button at the bottom of the dialog box, Sequescan will begin reading the bacterial signature list into memory, then classifying the reads in against this signature list. Output similar to that below will appear in the ‘Progress’ box at the bottom of the GUI:
Jul 21, 2013 12:28:51 PM  Reading current config file: /flash/sequedex/etc/sequescan/sequescan.conf
Jul 21, 2013 12:29:17 PM  Running mode with config file file:/flash/sequedex/etc/sequescan/sequescan.conf
Jul 21, 2013 12:29:17 PM  Validating license file /home/localhost/mcmahon/.sqdx/license.lic
Jul 21, 2013 12:29:17 PM  License level is 1
Jul 21, 2013 12:29:17 PM  Writing log files to: '/home/localhost/mcmahon/E.coli/log/sequescan_run_20130721_122917.html' with log level 'INFO'
Jul 21, 2013 12:29:17 PM  Start Sequescan Program (mode=run)
Jul 21, 2013 12:29:17 PM  Setting the output directory to input
Jul 21, 2013 12:29:17 PM  Running Sequescan with the following parameters:
input_file = /home/localhost/mcmahon/E.coli/NC_010473.ffn
output_dir = input
config_file = /flash/sequedex/etc/sequescan/sequescan.conf
signature_db = Life2550-32GB.0
function_set = seed_0911.m1
protein_fragment_cutoff = 15
thread_num = 1
db_writer_flag = true

Jul 21, 2013 12:29:18 PM  Valid input file extensions: fasta fst fna fas ffn fa fastq fq fasta.gz fst.gz fna.gz fas.gz ffn.gz fa.gz fastq.gz fq.gz
Jul 21, 2013 12:29:18 PM  It is assumed that input files contain DNA sequence; only A,C,T,G will be translated.
Jul 21, 2013 12:29:18 PM  Minimum protein fragment length is 15; if reads have less than 45 bp, you should decrease this value
Jul 21, 2013 12:29:18 PM  Reading signature map from data module
Jul 21, 2013 12:35:38 PM  Reading functions from data module
Jul 21, 2013 12:35:38 PM  Adding /home/localhost/mcmahon/E.coli/NC_010473.ffn to the queue as fasta
Jul 21, 2013 12:35:38 PM  Adding analysis observer gov.lanl.sequtils.writer.SequencingFileWriter for NC_010473.ffn
Jul 21, 2013 12:35:38 PM  Begin matching of reads in file /home/localhost/mcmahon/E.coli/NC_010473.ffn
Jul 21, 2013 12:35:41 PM  NC_010473.ffn: 4441680 chars processed (100.0 percent completed)
Jul 21, 2013 12:36:10 PM  End Sequescan Program
The log directory will contain a subdirectory with an html file that can be opened with a web-browser, indicating progress, errors, and warnings associated with this Sequescan run. Output files will appear in the subdirectory ‘NC_010473.ffn.sqdx’ of the directory where the input file was, and contain four types of outputs in two seperate formats (tab-separated-variables and json / tsvj); we examine the four types of tsv files in the next section. These files can be imported into Excel, a text editor, or simply examined on the command line with the ‘less’ or ‘cat’ commands.
4.2. Output files - stats
The output file Life2550-32GB-stats.tsv contains basic statistics about the computation. The stats file resulting for the above run contains:
Sequescan Version       1.0
Log File        /home/localhost/mcmahon/E.coli/log/sequescan_run_20130721_122917.html
Data Input File /home/localhost/mcmahon/E.coli/NC_010473.ffn
Data Output Directory   /home/localhost/mcmahon/E.coli/NC_010473.ffn.sqdx
Local Time      07.21.2013_12:36:04
Percent of File Processed       100.0
Processing Complete     true
Thread Pool Size        1
Processing Rate (Gbp/hr)        4.241
Reads In        4128
Bases In        3904869
Reads With Fragments >= 15 AA   4128
Frames Processed        24768
Frames with Fragments >= 15 AA  24707
Fragments In    306270
Fragments >= 15AA       142158
Reads Assigned  4060
Single-Signature Reads  37
Single-Node Reads       102
Monophyletic Reads      3645
Non-Monophyletic Reads  276
Fragments Assigned      4577
Percent of Reads Assigned       98.4
Total Size of Matched Fragments (bp)    3976512
Fragments Assigned      3226
Total Size of Fragments Assigned (bp)   3180642
Input Time(ms)  33
Translate Time (ms)     1358
Match Time (ms) 1410
Assignment Time (ms)    154
Other Time (ms) 360
Total Time (ms) 3315
The input file is listed on the top line, followed by the fraction of the file processed, which in this case is 100%. For large files, intermediate results are written to output files, and this line indicates an estimated fraction processed. In the case of a missing or invalid license file, only a fraction is prcessed, and that fraction would be indicated here. The ‘Processing Complete’ line indicates ‘true’ if the processing completed normally, whether because the end of the input file was reached or because a valid license was not found.
The Thread Pool Size of one is indicated, together with a processing rate of 4.241 Gbp/hr. When processing multiple files simultaneously, it is possible to have a dedicated Java thread processing each file, all comparing to the same memory map. The processing rate provided is of the single thread dedicated to this particular file. Typical values for computers in use as of this writing are 3.5 to 7 Gbp/hr, with the rate per thread dropping roughly a factor of two when 40-60 processors are running together. Thus a 64 core machine capable of 3.7 Gbp/hr on a single thread was able to process fasta files at the cumulative rate of 100 Gbp/hr, and each output file had a processing rate of 1.7 Gbp/hr.
The 4128 genes and 3904869 base pairs processed are indicated next, from which the average gene length of 948 base pairs can be computed. Of the 4128 genes processed, all contained at least one region with 15 or more consecutive amino acids uninterrupted by an undetermined nucleotide or stop codon. This cutoff value of 15 amino acides necessary for further consideration by Sequedex can be changed in the configuration file. Sequedex at present does not recognize ambiguity codons.
From the 4128 genes, 24768 reading frames were processed, of which 24707 contained an amino acid region with 15 or more concecutive amino acids. Since many of the reads contained mulitple fragments, 142158 peptide fragments longer than 15 amino acids were identified, of which 4577 (less than half) were of length 15 amino acids or longer.
Over-all, 69,170 reads (98.4% of the processed reads) contained at least one signature peptide and thus could be assigned a phylogenetic placement.
The next six lines break the total processing time (3.3 seconds) into input, translating, matching, assignment steps, as well as ‘other’. From the output shown above, reading in the Life-32GB.0 data module took the majority of the clock time of 7 minutes 41 seconds, while the reads were processed at a rate of 4.7 Gbp / hour.
4.3. Graphical output: Sequinator
Sequedex produces an interactive html output file of the phylogenetic profile for each analyzed sample - a tool we call Sequinator. Simply open the html file produced in the appropriate sqdx output directory with a web browser. An output similar to the one below will appear. For an active version of this figure, click here.
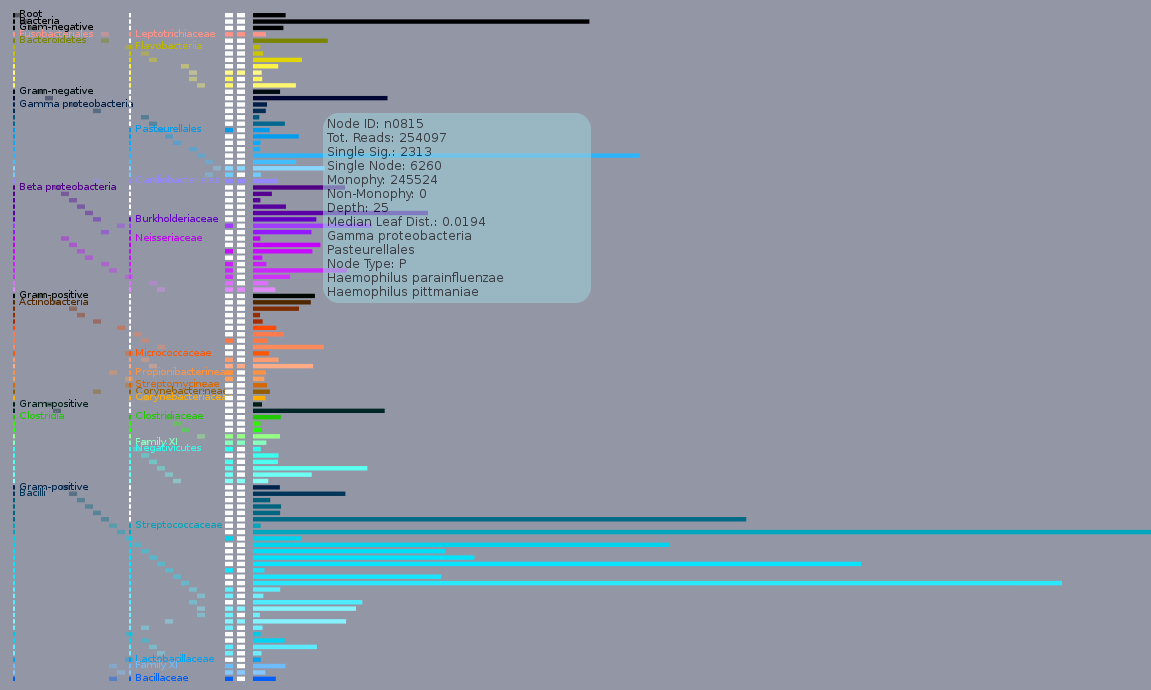
Screenshot of the Sequinator demo, which graphically displays the node counts found in a Sequescan ‘who’ file from a dental caries study. A variety of known members of the oral microbiota are shown, one of which, Haemophilus infleunzae is highlighted on the screen. Since Sequedex assigns reads to the nodes of the tree, rather than the leaves, the output is slightly more complex than a simple table. The 100 horizontal bars on the right 3/4 of the plot have a length proportional to the top 100 most populated nodes on the tree. When you move the mouse over one of the bars, information about the node are displayed, as indicated on the screen shot for node 815. To the left of the bars is information on the phylum and family of the node, as well as the depth of the node from the root to the leaves of the tree. Detalied definitions of parameters in the box are explained in the Who? section, below. Approximately half of the nodes are immediately above one or two leaves, and these nodes are indicated by coloring in one or both of the columns immediately to the left of the population bars. These organisms are reasonable suggestions as to specific organisms that may be present in the sample.
The colors of the bars reflect phylogenetic similarity. Deeply branching nodes (between the root and a phylum-level node) are black, while the rest of the nodes are colored in a manner that changes smoothly along the phylogeny (and is similar from sample to sample). This helps identify the distinct clusters of populated nodes that often appear in metagenomic samples.
4.4. Output files - Who?
The output file who-Life2550-32GB.tsv contains the phylogenetic profile derived from the fasta input file. It contains eight columns of data, containing node-numbers defined with respect to a reference phylogeny, labels for these nodes, and histograms of reads assigned to these nodes in several different ways. Several sections of this output file are shown below:
indx    id      total   single_sig      single_node     monophyletic    non_monophyl    depth   min_leaf_depth  root_dist       median_leaf_dist        level_0_name    level_1_name    taxon_id        node_type       leaf_0_name     leaf_1_name     color   width   path
0       n0000   151167  72994   59747   0       18426   0       4       0.0000  1.7234  Root    Root    1       I       NA      NA      #000000 12      0
1       n0001   874316  205831  377350  178906  112229  1       5       0.0823  1.6723  Bacteria        Bacteria        2       I       NA      NA      #000000 12      0.1
2       n0002   154920  32755   18795   62076   41294   2       4       0.1198  1.5292  Gram-negative   Gram-negative   -1      I       NA      NA      #000000 11      0.1.2
3       n0003   30464   6292    3310    17987   2875    3       3       0.2698  1.4586  Gram-negative   Gram-negative   -1      I       NA      NA      #553f00 9       0.1.2.3
4       n0004   1875    345     62      1320    148     4       3       0.3288  1.3869  Gram-negative   Gram-negative   -1      I       NA      NA      #932600 8       0.1.2.3.4
5       n0005   90      29      35      26      0       5       2       0.3822  1.3777  Gram-negative   Gram-negative   -1      I       NA      NA      #ad1c00 7       0.1.2.3.4.5
6       n0006   16      2       14      0       0       6       1       0.9312  0.7069  Elusimicrobia   Elusimicrobia   74152   P       Termite group   Elusimicrobium minutum  #ff8988 2       0.1.2.3.4.5.6
7       n0007   7353    874     950     5013    516     6       3       0.5002  1.2885  Gram-negative   Gram-negative   -1      I       NA      NA      #af1d00 7       0.1.2.3.4.5.7
8       n0008   42387   6604    13294   19396   3093    7       2       1.3383  0.4828  Fusobacteriales Fusobacteriales 203491  I       NA      NA      #ff1202 5       0.1.2.3.4.5.7.8
9       n0009   3307    231     334     2742    0       8       1       1.5307  0.3248  Fusobacteriales Fusobacteriaceae        203492  S       Ilyobacter polytropus   NA      #ff2316 5       0.1.2.3.4.5.7.8.9
10      n0010   21530   1622    5090    14062   756     9       2       1.5909  0.3032  Fusobacteriales Fusobacteriaceae        203492  I       NA      NA      #ff281a 5       0.1.2.3.4.5.7.8.9.10
11      n0011   471     59      55      357     0       10      1       1.6541  0.0753  Fusobacteriales Fusobacteriaceae        203492  S       Fusobacterium mortiferum        NA #fe655d 3       0.1.2.3.4.5.7.8.9.10.11
12      n0012   833     249     76      508     0       11      1       1.7189  0.0159  Fusobacteriales Fusobacteriaceae        203492  S       Fusobacterium varium    NA      #fe766f 3       0.1.2.3.4.5.7.8.9.10.11.12
The first seven columns of the phylogenetic profile contain the phylogenetic profile of the metagenomic sequence file processed:
- indx: Index starting at 0
- id: node id. consistent with
phyloxmlreference tree. - rollup_category: general category name. May include several phylum for nodes near the root
- total: Total number of reads attributed to the node
- single_sig: Number of reads containing only one signatures
- single_node: Number of reads containing multiple signatures, but all of them belonging to the same node
- monophyletic: Number of reads containing multiple signatures that are consistent along the phylogeny
- non_monophyl: Number of reads containing multiple signatures that are inconsistent with the phylogeny
The last thirteen columns contain a variety of details about the nodes numbered in the first two columns, and are idential for all samples processed. The columns are:
- depth - the number of nodes from the root of the tree
- min_leaf_depth - the shortest distance to a leaf, in nodes
- root_dist - the phylogenetic distance to the root
- median_leaf_dist - the median phylogenetic distance to the leaves
- level_0_name - top level name in the Sequedex hierarchy: frequently corresponding to the phylum or order
- level_1_name - mid level name in the Sequedex hierarchy: frequently corresponding to the family
- taxon_id - the NCBI taxnomony ID of the node
- node_type - I for internal nodes, S for semi-preterminal nodes (above one leaf), and P for preterminal node (above two leaves).
- leaf_0_name - if the node is immediately above a leaf, the name of the leaf
- leaf_1_name - if the node is immediately above two leaves, the name of the second leaf
- color - a color code, which can be used to provide a consistent color-code in plots
- width - an integer characterizing the breadth of phylogeny covered by a node
- path - a list of all of the nodes on the path from the node to each node.
Visualization of the phylogenetic profiles can be aided by placing the
counts onto the phylogenetic tree.
4.5. Output files - What?
Functional profiles are computed using a reference database of functional categories. The default functional classification is derived from that used by the SEED project (http://www.theseed.org) database as described in detail in Ref. [1] The functional profiles count the number of open reading frames associated to each functional category. Because many signatures occur in multiple SEED categories and each reading frame gets a total of one count, categories often are assigned a fractional count.
Approximately 70% of the phylogenetic signatures can be associated with one or more SEED subsystems.
The output file what-Life2550-32GBxseed_0911.m1.tsv contains the functional profile derived from the fasta input file. The carbohydrate section of this file is shown here::
indx    fragments       id      level1  level2  subsystem
0       19.1    si_0000 Amino Acids and Derivatives     Alanine, serine, and glycine    Alanine_biosynthesis
1       15.1    si_0001 Amino Acids and Derivatives     Alanine, serine, and glycine    Glycine_Biosynthesis
2       59.2    si_0002 Amino Acids and Derivatives     Alanine, serine, and glycine    Glycine_and_Serine_Utilization
3       31.5    si_0003 Amino Acids and Derivatives     Alanine, serine, and glycine    Glycine_cleavage_system
4       16.6    si_0004 Amino Acids and Derivatives     Alanine, serine, and glycine    Serine_Biosynthesis
...
63      65.7    si_0063 Carbohydrates   Central carbohydrate metabolism Dehydrogenase_complexes
64      10.9    si_0064 Carbohydrates   Central carbohydrate metabolism Dihydroxyacetone_kinases
65      72.2    si_0065 Carbohydrates   Central carbohydrate metabolism Entner-Doudoroff_Pathway
66      18.5    si_0066 Carbohydrates   Central carbohydrate metabolism Ethylmalonyl-CoA_pathway_of_C2_assimilation
67      31.6    si_0067 Carbohydrates   Central carbohydrate metabolism Glycolate,_glyoxylate_interconversions
68      85.4    si_0068 Carbohydrates   Central carbohydrate metabolism Glycolysis_and_Gluconeogenesis
69      28.9    si_0069 Carbohydrates   Central carbohydrate metabolism Glycolysis_and_Gluconeogenesis,_including_Archaeal_enzymes
70      34.7    si_0070 Carbohydrates   Central carbohydrate metabolism Glyoxylate_bypass
71      18.3    si_0071 Carbohydrates   Central carbohydrate metabolism Methylglyoxal_Metabolism
72      0       si_0072 Carbohydrates   Central carbohydrate metabolism Particulate_methane_monooxygenase_(pMMO)
73      77.6    si_0073 Carbohydrates   Central carbohydrate metabolism Pentose_phosphate_pathway
74      2.4     si_0074 Carbohydrates   Central carbohydrate metabolism Peripheral_Glucose_Catabolism_Pathways
75      28      si_0075 Carbohydrates   Central carbohydrate metabolism Pyruvate:ferredoxin_oxidoreductase
76      22.3    si_0076 Carbohydrates   Central carbohydrate metabolism Pyruvate_Alanine_Serine_Interconversions
77      80.9    si_0077 Carbohydrates   Central carbohydrate metabolism Pyruvate_metabolism_I:_anaplerotic_reactions,_PEP
78      109.1   si_0078 Carbohydrates   Central carbohydrate metabolism Pyruvate_metabolism_II:_acetyl-CoA,_acetogenesis_from_pyruvate
79      1       si_0079 Carbohydrates   Central carbohydrate metabolism Soluble_methane_monooxygenase_(sMMO)
80      121.4   si_0080 Carbohydrates   Central carbohydrate metabolism TCA_Cycle
81      19.3    si_0081 Carbohydrates   Di- and oligosaccharides        Beta-Glucoside_Metabolism
82      23.2    si_0082 Carbohydrates   Di- and oligosaccharides        Fructooligosaccharides(FOS)_and_Raffinose_Utilization
83      35      si_0083 Carbohydrates   Di- and oligosaccharides        Lactose_and_Galactose_Uptake_and_Utilization
84      10.2    si_0084 Carbohydrates   Di- and oligosaccharides        Lactose_utilization
85      88.9    si_0085 Carbohydrates   Di- and oligosaccharides        Maltose_and_Maltodextrin_Utilization
86      1.8     si_0086 Carbohydrates   Di- and oligosaccharides        Melibiose_Utilization
87      5.9     si_0087 Carbohydrates   Di- and oligosaccharides        Sucrose_utilization
88      1.6     si_0088 Carbohydrates   Di- and oligosaccharides        Sucrose_utilization_Shewanella
89      72.8    si_0089 Carbohydrates   Di- and oligosaccharides        Trehalose_Biosynthesis
90      13.7    si_0090 Carbohydrates   Di- and oligosaccharides        Trehalose_Uptake_and_Utilization
91      0.3     si_0091 Carbohydrates   Di- and oligosaccharides        Unknown_oligosaccharide_utilization_Sde_1396
92      35.6    si_0092 Carbohydrates   Fermentation    Acetoin,_butanediol_metabolism
93      9.1     si_0093 Carbohydrates   Fermentation    Acetone_Butanol_Ethanol_Synthesis
94      62.6    si_0094 Carbohydrates   Fermentation    Acetyl-CoA_fermentation_to_Butyrate
95      26.4    si_0095 Carbohydrates   Fermentation    Butanol_Biosynthesis
96      21      si_0096 Carbohydrates   Fermentation    Fermentations:_Lactate
97      24.5    si_0097 Carbohydrates   Fermentation    Fermentations:_Mixed_acid
...
The columns of this file are::
*   indx :  Index, starting at zero
*   fragments: Number of fragment assigned to that SEED category
*   id : SEED identification number
*   level1 : Level 1 SEED category descriptor
*   level2 : Level 2 SEED category descriptor
*   subsystem : Level 3 or subsystem SEED category descriptor
More information about particular SEED subsystems can be obtained at http://www.theseed.org/SubsystemStories, but the user should note that the index numbers above (eg. si_0094) are only defined within the Sequedex distribution.
4.6. Output files - Who does what?
The output file tabulates the number of reads in each phylogeny and functional category. It is a matrix with 402 columns and 911 rows, corresponding to the phylogeny vector defined by the reference phylogeny and the functional vector defined by the SEED subsystems. A portion of this matrix is shown below, centered around the cyanobacteria and the carbohydrate metabolism subsystems::
id          n000     n001   n002    n003    n004    n005    n006     ...
...
si_0069     13      0.6     0.8     0       0.1     0       0
si_0070     9.7     0.7     0       0       0       0       0
si_0071     4.9     0       0       0       0       0       0
si_0072     0       0       0       0       0       0       0
si_0073     28.6    1.6     0       0       0.3     0       0
si_0074     0.4     0.4     0       0       0       0       0
si_0075     13.1    1.5     0       1       0       0       1
si_0076     5.3     0       0       0       0       0       0
si_0077     27      1.7     0.3     0       0       0       0
si_0078     26.7    2.6     0       0       0       0       0
si_0079     0       0       0       0       0       0       0
si_0080     26.3    2.8     0       0       0       0       1
si_0081     5.4     0.5     0       0       0       0       0
si_0082     5.6     0.9     0.3     0       0       0       0
si_0083     11.1    3.2     0       0       0       0.3     0
si_0084     1.4     0       0.3     0       0       0       0
si_0085     27.6    9.3     0.3     0.5     0.5     0       0
si_0086     1       0.3     0       0       0       0       0
si_0087     1.5     0.1     0.3     0       0       0       0
si_0088     0.3     0       0       0       0       0       0
si_0089     20.5    1.1     1.3     0       0       0       0
si_0090     3.5     0.7     0       0       0       0       0
si_0091     0       0       0       0       0       0       0
si_0092     7.9     3.3     0       0.5     0       0       0
si_0093     2.5     0.6     0       0       0       0       0
si_0094     14.8    1.8     0       0       0       0       0
si_0095     6.6     0.4     0       0       0       0       0
si_0096     6.8     0.5     0       0       0       0       0
si_0097     4.2     0.8     0       0       0       0       0
si_0098     0.3     0       0       0       0       0       0
...
Generally, this will be most useful on the larger data sets, as the counts are spread across approximately 400,000 bins. Given the even increasing number of reads generated by modern sequencers, we expect to have available sufficiently many reads to provide statistical resolving power. As discussed in the phylogeny and the functional profile output files, the results must be put into context with the used databases.
4.7. Obtaining annotated reads: Analysis of E. coli proteome
One way to validate Sequedex is to provide an input file derived from a single organism and observed the phylogenetic profile produced by Sequedex. Since Sequedex requires the input file to be nucleotide sequence, one cannot at present input amino acid sequences. Six-frame translations are automatically performed on input files, which must be sequeces of A, T, G, and C. NCBI does, however, distribute files with nucleotide sequences of each of the genes in their completed and draft genomes at their ftp site. We provide here instructions for analyzing E. coli, but they are readily extensible to any of the other genomes available from the same location.
To see the phylogenetic profile Sequedex produces from the E. coli genome, download the ffn file from NCBI, at ftp://ftp.ncbi.nih.gov/genomes/Bacteria/Escherichia_coli_K_12_substr__DH10B_uid58979/NC_010473.ffn and run Sequescan on it, as described above, except select ‘true’ for the ‘Write Database’ pull-down menu. This will cause Sequescan to write an output fasta file with annotated versions of all of the reads it identifies.
Examination of the Life2550-40GB-stats.tsv file reveals:
- 4,128 reads were processed, with 95 % of them phylogenetically identified, and 3,163 fragments assigned a function.
- After the signature list was read into memory, 4.6 seconds were spent translating and 2 seconds were spent matching to the signature list.
- More than 99 % of the reads contained multiple signature peptides.
Examination of the file reveals:
- A total of 12 nodes of the tree were assigned reads, with 90 % of them assigened to the most specific node above E. coli.
- Examination of
the Life2550 treeshows that nearly all of the remainder are assigned to nodes on a path from the root to E. coli.
Examination of what-Life2550-40GBxseed_0911.m1.tsv reveals:
- 810 seed categories contained a match to at least one gene in E. coli.
- More than thirty genes were identified in four SEED categories: Flagellum, DNA Repair, LSU of the Ribosome, and DNA Replication.
Examination of db-Life2550-40GBxseed_0911.m1.fa reveals:
- Genes 2,3, and 4 of E. coli were correctly identified as in SEED category si_0046 ; Serine - threonine metabolism.
- Seed category si_0746, identified RNA polymerase alpha, beta, beta prime, and omega subunits, as well as two hypothetical proteins and penicillin-binding protein 1b.
Once the user is familiar with this process, it is easy to substitute any of the 2300 other completed bacterial genomes available at this ftp site. For example, you can download a tar file with nucleotide sequences coding for genes in each of 2300 completed bacterial and archael genomes at ftp://ftp.ncbi.nih.gov/genomes/Bacteria/all.ffn.tar.gz. Running various individual proteomes through Sequedex will give the user some indication of the precision and sensitivity with which genes can be classified. Note that this is an excellent situation to use the ‘list file’ under ‘input type’ as the ffn files will be located in directories corresponding to the organism. Sequedex will separate the output files in a similar directory structure under the directory specified under ‘Output (Top-Level)’
4.8. Analysis of multiple files in parallel with the GUI
Sequedex can process multiple fasta files in parallel, as a single batch. Besides eliminating the need to individually specify each fasta file with the GUI, batch processing of fasta files results in a significant speedup of computation time, because the signature list being read only once, and enables parallel processing of the fasta files with individual Java threads.
A set of sixteen synthetic metagenomic datasets were used in Berendzen et al. [1] to examine the read-length of the sensitivity and specificity of Sequedex on four separate clonal populations of bacteria. These files are provided with the Sequedex distribution in the testData directory under the ‘synthetic’ subdirectory. To process these files together, we can select the ‘directory’ option from the ‘Input type’ pull-down menu, locate the directory these fasta files reside in the ‘Input’ dialog box, and enter ‘4’ or more in the box by the ‘Thread Number’ option. Upon clicking on ‘Run Sequedex’, the files will be processed in a batch, with the results appearing in separate subdirectories under ‘data/output’.
Alternatively, the files to be analyzed can be listed, with their complete paths, in an input file which is selected in conjunction with the ‘list file’ option under ‘input type’ dialog box. On a Linux or Mac platform, it is possible to generate a complete path by including the full path in the ‘ls’ command as follows (which must conform to the path relevant to your own system):
ls -1 /home/username/sequedex/testData/synthetic/*.fna
4.9. The virus1252 data module
Sequedex also has a one-per-species viral tree of 1252 taxa and associated data module, available at http://sequedex.lanl.gov. To use this data module, simply download the data module and place it into the sequedex/data directory, then either select ‘virus1252’ from the pull-down menue (if using the Sequedex GUI) or specify it after the -d flag (if running Sequedex on the command line - see below).
For example, to analyze this virus.test.fasta data file and run the command:
sequescan run -d virus1252.1 -s pfam27 -f 1 virus.test.fasta
to generate Sequedex output, which by default will appear in the subdirectory virus.test.fasta.sqdx. Note that the virus1252 data module uses functional classifications from pfam release 27, which contains families for many of the viral proteins. This provides greatly increased confidence in interpreting output in samples with a low abundance of reads.
4.10. Alternative data modules and memory usage
Sequedex is designed to match nucleotide sequences against a list of signature peptides that each posses both a phylogenetic and functional annotation. The original manuscript on soil metagenomics used a comparatively small set of 20 million signatures derived from 403 bacterial reference genomes (one-per-genus) and functions defined by the SEED project, and this is the default data module described above. Sequedex version 1.0, released in the Summer of 2013, expanded this data set to one-per-species representation across all of the kingdoms of life, including 2550 taxa. The signature list was phylogentically thinned at the leaves to provide a data module of ~180 million signatures, fitting in under 40 GB of RAM. In addition to the 40 GB data module, additional data modules have been created and are distributed at the Sequedex website (http://sequedex.lanl.gov), designed to fit easily in 32,16, 8, and 4 GB of RAM. The sensitivity is shown for different data modules and across the phylogeny of reference genomes in teh next two figures.
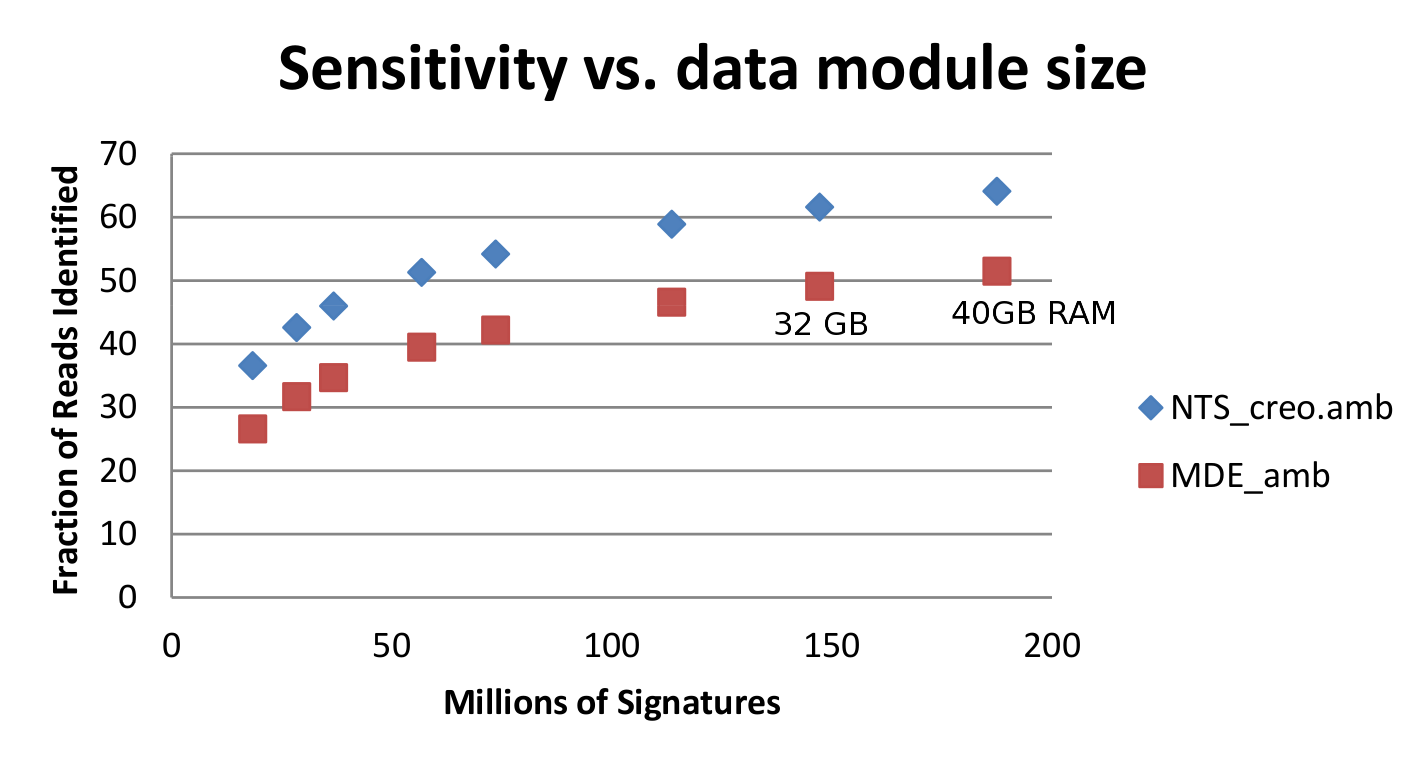
The fraction of reads indentified in two soil metagenomics samples sequenced on a 454 sequencer for eight module sizes. Five of these modules are distributed at the Sequedex website. The modules all utilize the same trees and functional database, and are thinned by randomly discarding signatures from the 40 GB module.
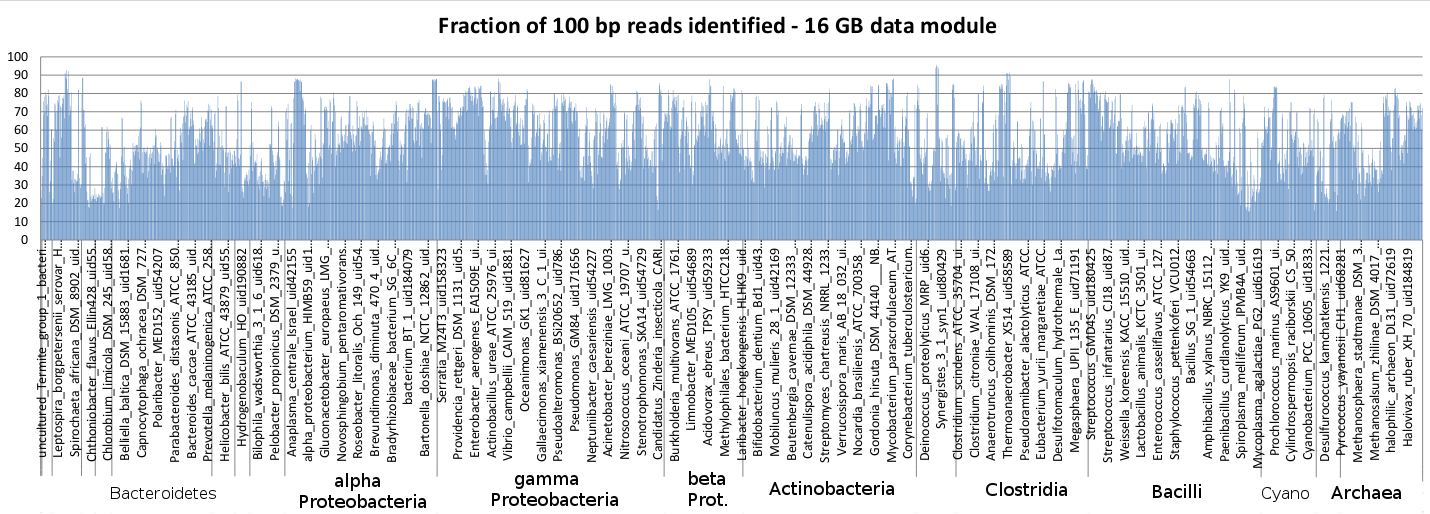
The phylogenetic dependence of Sequedex’s sensitivity across the bacterial and archael reference genomes, which were chopped into 100 bp reads and analyzed with Sequedex. The genome names are shown in the same order as they appear in the Sequedex reference tree. Note that most of the genomes are recognized with a sensitivity between 35% and 70%, providing a relatively small dependencey on whether or not the organism comes from a well-represented portion of the phylogenetic tree. Since signatures are required to be in two or more reference genomes, the sensitivity of Sequedex in detecting novel species and genera is not much less than its sensitivity against these reference genomes (in contrast to nucleotide-based detection methods and methods that do not use phylogeny as an importance filter).
We recommend that the user familiarize himself or herself with the software and output using a system with 4 or 8 GB of RAM and using the Life2550-4GB or Life2550-8GB data module distributed with Sequedex and set as default with the GUI. Additionally, smaller versions of tol-all are available. For many purposes, the lower sensitivity may not matter too much, but it is likely that the user will want to spend the $1000 necessary to acquire a desktop machine with 32 GB of RAM.
Sequedex enables the memory request of Java to be set either in configuration files or with an environment variable. See Reference for details.
By setting the memory size of 30 GB somewhat smaller than the system size (in this case, 32 GB), it is possible to use other applications while Sequedex is running, without significantly affecting the performance of Sequedex. The user may need to experiment to find optimal parameters for his or her individual needs.
4.11. Running Sequedex from the command line
Many users will find it advantageous to run Sequedex from the command line, which is availble to all users of Mac and Linux systems, and can be obtained for Windows by installing the Cygwin package http://www.cygwin.com.
However you acquire your command line, it is most convenient to change directories to where your data resides, the execute the particular Sequedex run. Help with the basic syntax can be obtained by typing:
sequescan run -h
which provides the following output:
Command line execution of sequescan run mode:
sequescan run [-h] [-q] [-c config_file] -d data_module [-o output_directory] [-s function_set] [-a min_prot_frag_length] [-t thread_num] [-f database_writer_flag] [-l] INFILE

Example:
sequescan run -d Life2550-4GB.0 -s seed_0911.m1 -f 1 /Users/jsmith/mgData

Option descriptions:
-h    mode help
-q    quiet option - less messages to console or progress window
-c    user-defined configuration file (overrides system configuation file)
-d    name of data module
-o    user-defined directory for data output (default is directory where input is located)
-s    name of function set
-a    minimum protein fragment length (overrides configuration file; default is 15)
-t    maximum number of threads in threadpool (default = 1)
-f    database writer flag (arguments:  0 = no, 1 = yes); analysis_writer_list in config determines type of database (currently fasta/fastq file)
-l    required if INFILE contains list of fasta/fastq files; if argument is none, list contains absolute paths;
     otherwise argument is base directory and paths in list are relative to base directory;
     when paths are relative to base directory and the -o option is set, output will inlcude relative paths

INFILE may be a fasta/fastq file, a directory with fasta/fastq files,
or a file containing a list of fasta/fastq files.
However, only fasta or fastq files or their gzipped (.gz) versions with an extension
in the config file parameter fa_ext_list will be processed.
Thus, running Sequescan from the directory with the fasta files with the command line:
sequescan run -v -d Life2550-8GB.0 -s seed_0911.m1 -f 1 -o out_dir infile.fas
will run Sequescan with the Life2550-8GB.0 data module and seed_0911.m1 functional classification of the signatures distributed with this release. Sequescan will match all of the reads in infile.fas and create the directory out_dir in which it will place the results (in a subdirectory), including the writing of a fasta file with each read containing a signature peptide, in the reading frame which results in that signature, annotated by phylogenetic and functional assignment.
Alternatively, the command line:
sequescan run -v -d Life2550-8GB.0 -s seed_0911 -f 0 -t 20 -o out_dir . >& err &
will run Sequescan as before, except processing all of the files with an appropriate file extension (by default, fasta, fst, fna, fas, and ffn, specified in sequedex/etc/sequescan/sequescan.conf) as a group, using 20 Java threads, without producing an annotated fasta file and again with the output appearing in subdirectories of out_dir. By placing ‘>& err &’ at the end of the command, the output normally appearing on the screen will be sent to the file, ‘err’, and the process will run in the background, allowing the terminal window to be used for other commands while Sequescan is running. The output files can be written to a different directory tree if one or both directories are supplied with appropriate paths. This enables users to leave shared data directories untouched by output files produced by Sequedex without the need for recopying potentially large input files.
This remaining of this section describes the generated results from sequescan, which includes a phylogenetic profile, a functional profile, a matrix of function x phylogeny that informs on “who does what”, and a fasta or fastq file of annotated reads. Visualization and interpretation of these profiles are discussed in Initial analysis with Sequedex: Phylogenetic and functional profiles, Annotated reads, and Comparing Samples.
4.12. The Sequedex configuration utility and sequescan.conf
Seuedex can be configured through environment variables accessible through a configuration file, described in Environmental variables and a configuration file, described in Configuration options.
The environmental variables, most easily accessed with the utility sequedex-config, enable alternate locations for files such as data modules, trees, and configuration files, and programs, such as python, java, or the web browser used by Sequenator. Sequedex detects reasonable defaults for these variables when sequedex-bootstrap is run upon initial installation, and sequedex-config provides a short description for how each variable was set.
- The amount of memory can be changed. If the memory is set to a value larger than
the available RAM on your computer, the computer may need to swap, described here, which, if it occurs to any significant amount, will severely degrade the rate at which Sequescan runs. If the memory is set to a small value, Sequedex, through Java, will attempt to manage the signature lists in a prohibitively small hash map with techniques such as those described here, again leading to severe degradation of performance.
The configuration file, sequedex/etc/sequescan/sequescan.conf, contains a variety of settings controlling default behavior of inputs and outputs of Sequescan. For example:
- Sequedex can read fasta, fastq, and gzipped fasta and fastq files. The file-type is identified by the file extensions, which can be changed, and are listed in the configuration file.
- The location and names of output files can be changed with variables in the configuration file. Some discussion of the logic associated with this option is available in Directory structures for data, output files, and analysis.
- The default minimum length of open reading frames to be processed can be defined both on the command line and in the configuration file. If the input sequence file has only 36 base pairs per read, the default setting of 15 amino acids will prevent any reads from being identified.
4.13. Directory structures for data, output files, and analysis
The choice of directory structures and file names for accessing, archiving, and analyzing large sequencing files can be challenging, and the user likely has a system in place. Because multi-threaded analysis of multiple files in one run can occur in parallel and with a single memory map is so efficient, Sequedex can be run by giving it the name of an input directory containing multiple sequence files and a top-level output directory (which can be the same as the input directory). Sequedex will then create separate output directories for each sequence file, naming it by simply appending ‘.sqdx’ to the input filename. Analysis of the same data file with different data modules will go in the same output directory, but with the filenames distinguishing the data module used.
Because of the large file sizes, the user is encouraged to be aware of which disks are local and which are remote, where reading and writing to disk may be slow. Also, Sequedex is capable of uncompressing gzipped fasta or fastq files directly.
One logical way to organize further analysis is to keep files associated with each sample in that sample’s directory, while cross-sample analysis can be one directory above that. Symbolic links can be used to create shorter and more meaningful names to sample directories, while preserving the original name, which is often necessary to backtrack to the original sample identity.
Many possibilities exist for organizing data, but the user is encouraged to put some deliberate thought into the problem before creating the large number of potential output files that can be created by the analysis enabled by Sequedex.
| [1] | (1, 2, 3) Berendzen, J., WJ Bruno, JD Cohn, NW Hengartner, CR Kuske, BH McMahon, MA Wolinsky, G Xie, “Rapid phylogenetic and functional classification of short genomic fragments with signature Peptides”, BMC Research Notes, August, 2012 (http://www.biomedcentral.com/1756-0500/5/460/) |