2. Introduction to Sequedex
2.1. What is Sequedex?
Sequedex is a licensable software package for genomic analysis that was developed by an interdisciplinary team of scientists at Los Alamos National Laboratory with funding from the Laboratory-Directed Research and Development (LDRD) program. It is currently available for use with a fully functional, node-locked, six month demo license from the Technology Transfer Division of Los Alamos National Laboratory at http://sequedex.lanl.gov. The software is under active development, and information about future releases will be made available at this website, and by an email distribution to the list of users downloading the software. A publication describing the method behind Sequedex, its underlying scientific basis in evolutionary theory and protein structure, its validation on synthetic metagenomic data, and its application to ten soil metagenomics datasets has been published. [1] It was a recepient of a 2012 R&D 100 award. [2]. It is a very flexible piece of software, which can utilize multiple data modules and downstream analysis scripts. It is very fast, reading in signature lists of 5-500 million peptide signatures in 1-15 minutes, and subsequently processes genomic fragments at the rate of 6 Gbp/hr. It parallelizes without significant increase in memory requirements until I/O bound on multiple input files; parallelization works well on 64 processors.
Sequedex has a public repository, wiki, and mailing list on GitHub at http://github.com/joelb123/Sequedex. In the repository will be placed analysis scripts, documentation, and results of Sequedex runs on other data sets that you may compare your data to. Sequedex users should check the site from time to time. The html version of the documentation contains numerous web links and downloadable files.
2.2. What does Sequedex do?
Sequedex is a very flexible piece of software that can be used in conjunction with other software tools to solve a wide variety of problems. It requires a data module such as Life2550-40GB.0 or virus1252 and an input file of sequence data in either fasta, fastq format in plain text or compressed as fasta.gz or fastq.gz. Sequedex will then output four things:
- Genomic fragments in the correct reading frame, annotated by phylogeny (for example, the 2550 nodes defined by Sequedex’s Life2550 tree) and function (for example, the 963 categories defined by the seed_0911 functional classification).
- The phylogenetic profile, with a file format described in Output files - Who? and reference organisms described in Tree of Life, 2550 taxa for Life2550 and Viral tree, 1252 taxa for virus1252 data modules.
- The functional profile, with a file format described in Output files - What? and reference functional categories defined in Definition of functional classifications for the seed_0911 categories.
- The ‘Who does what?’ matrix, with a file format described in Output files - Who does what?.
- Statistics about matching reads, with a file format described in Output files - stats.
From these outputs, and suitable reference data, such as that described in Phylogenetic rollups and Reference data, it is possible to answer a wide variety of questions, such as:
- Is an organism that is nearly identical to a sequenced reference genome present in the sample?
- Is a high abundance of a novel organism present in the sample?
- Can I perform host, geographic, or temporal attribution on a sample?
- Are phenotypic (drug resistance, virulence, metabolism) markers present?
- Are multiple samples clonally related?
- Can molecular mechanism be inferred from environmental or expression data?
2.3. How is Sequedex different from other sequence analysis packages?
- Sequedex identifies reads by matching to conserved amino acid signatures, rather than the nucleotide matching of most rapid read mappers. This results in better sensitivity for organisms not closely related to something in the reference database.
- Sequedex uses solid amino acid matches of length ten that imply gene homology, rather than the shorter patterns employed by binning tools. This results in the ability to profile sequence data sets both functionally and phylogenetically.
- Sequedex annotates individual reads with function and phylogeny for more detailed analysis or assembly, and places them in the correct reading frame for translation. Then enables a variety of downstream analysis such as targeted and de novo assembly, followed strain identification or analysis of particular genes.
- Sequedex combines a firm grounding in evolutionary theory and phylogenetic analysis with search-engine technologies.
- Sequedex replaces the question, ‘How similar is this nucleotide sequence to those in a reference database?’ with the question ‘Where has this peptide signature been observed before?’.
- Sequedex tests phylogenetic specificity on a signature-by-signature basis, and is thus less sensitive to the confounding effects of domain swapping, paralogs, and horizontal gene transfer.
- Sequedex relys on an explicit RNA-polymerase based phylogeny to separate the effects of inheritence from functional pressure when interpreting genomic data.
- Sequedex can subsume functional classification schemes merely by searching example gene sets comprising a functional classification with phylogenetically-derived signature lists.
- Sequedex classifies gene fragments at a rate of 6.6 Gbp/hour, 250,000 times faster than BLASTX against NCBI’s NR database on soil metagenomics data and runs on a laptop.
2.4. Who uses Sequedex?
Although the Sequedex software package was developed specifically to analyze large shotgun metagenomics data sets characterizing bacterial communities living in soils, just about anyone who generates or analyzes genomic data, or studies systems where microbial communities are important is a potential user of Sequedex. Specifically:
Sequedex is written in Java and designed to run on modern laptop or desktop computers running Linux, Windows, or Macintosh operating systems
Sequedex is designed to run on computers with a moderate amount of memory that are readily available to data generators. Sequedex requires less than 4 GB of RAM for the 20 million signatures in the Bact403 data module, while the complete tree of life tree, with 160 million signatures will run in 29 GB of RAM. By enabling analysis on desktop (or laptop!) computers, we will enable analysis with rapid turn-around by the same people who best understand the metadata, sample preparation protocols, and expected relationship of the data to previously published studies.
In the process of developing Sequedex, the authors have collaborated with microbial ecologists, microbiologists, evolutionary biologists, medical doctors, epidemiologists, biochemists, and cellular biologists, exploring applications such as profiling microbial communities and microbiomes, identifying attributable changes in microbial communities and microbiomes with condition, enzyme mining, pathogen diagnosis, transcriptomic and proteomic analysis of different strains of algae in differential conditions, and forensic science. In each case, we have found Sequedex to compare favorable to existing methods in the hands of research scientists at the forefront of their field.
The developers have used Sequedex on all 48 cores of a modern server, to effectively run large datasets such as those derived from the human microbiome project or the diversity of environmental microbiomes deposited in NCBI’s short read archive. Because of its speed and robust read-by-read classification on a phylogenetic tree, the ability of users to compare their samples to archival data is limited only by their willingness to download, curate, and understand reference datasets. Even the simple distance metrics described below show that meaningful comparisons across research groups, sequencing methodologies, and ecosystems can be made, in order to understand the phylogeny and function of metagenomics samples in comparison to existing datasets. We thus also expect Sequedex to be useful to genomic data centers as they struggle to organize the flood of genomic data into useful ecological, medical, and microbiological conclusions.
2.5. How is Sequedex used with other software?
Sequedex performs a role, phylogenetic and functional annotation of individual reads, that sits at the core of bioinformatics. While direct analysis of Sequedex output is often sufficient to answer the user’s questions, it may also spur follow-up questions to obtain more detail or confidence in the results. It is helpful in understanding this to consider the process diagram below, for taking sequence data from the sequencer to various biological conclusions.
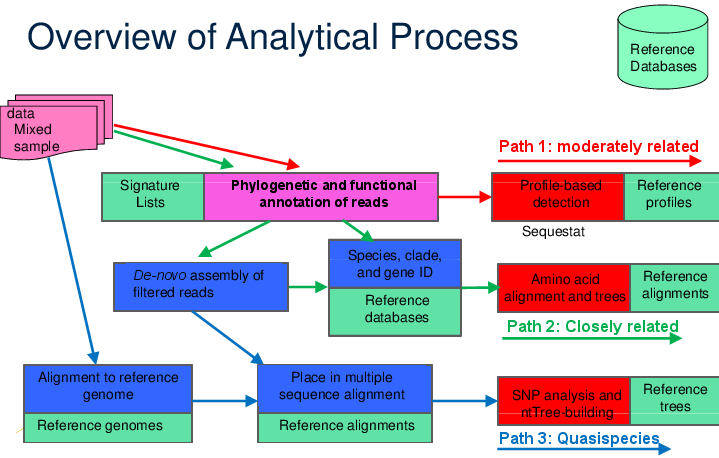
A schematic of how Sequedex can fit into a larger analysis protocol by providing phylogenetic and functional annotation of reads. A complex sample can be analyzed for phylogenetic and functional content directly with Sequedex to give an overall profile of the sample’s composition, even if it is composed of sequence from organisms only moderately related to anything in the reference database (Path 1 through protocol). Alternatively, Sequedex can be used as a filter to create phylogenetically or functionally (or both) filtered subsets of reads for de novo assembly and further analysis of the larger assemblies with, for example, blastn against NCBI’s nt database or blastp against NCBI’s nr database to identify organisms closely related to a reference organism (Path 2 through protocol). If these two analyses show high similarity and high abundance of reads to an organism for which a reference genome is available, a read mapper, such as BWA or Bowtie2 can be used to recruit and align reads for quasispecies analysis (Path 3 through protocol).
While the tasks in this diagram, such as aligning reads to a reference genome, de-novo assembly, or gene identification are often applied directly to the raw data, such directed application is often extremely expensive computationally and can lead to ambiguous results. By incorporating these applications in an analytical process with Sequedex, however, much more targeted questions can be asked, and on subsets of reads with known reading frames. Most exploration of even large next-gen sequencing runs can occur interactively, with most analysis questions requiring only a few seconds or a few minutes to run on a laptop or desktop computer. We guide the reader through numerous examples in this documentation.
2.6. How does Sequedex work?
The Sequedex software distribution contains a Java executable that rapidly searches genomic fragments against a classified signature list, and a data module consisting of a signature list, phylogenetic tree, and a functional classification. Sequedex first reads the signature list into a hash map, then sequentially matches each read of an input fasta file against this list, generating an output consists of three output files: a phylogenetic profile, a functional profile, and a matrix consisting of the number of reads tallied by both function and phylogeny.
The specific algorithm by which reads are assigned phylogeny and function is diagramed below. Each signature is placed on the tree at the most specific node covering all leaves at which the signature was observed. For example, if a particular 10-mer is observed in the genomes of the seven taxa indicated by blue dots in the figure below, that signature is assigned to the node indicated by the arrow. A similar algorithm, the least common ancestor, is employed for the frequent case of multiple signature peptides occurring in a single metagenomic read. Each read is placed on the tree at the most specific node consistent with the signatures contained in the read. For example, if a read contains signatures assigned to the seven nodes indicated in red on the figure below, the read is placed at the node indicated by the arrow. If conflicting specific signatures are contained in a read, it is assigned at the most specific node covering both conflicting specific assignments.
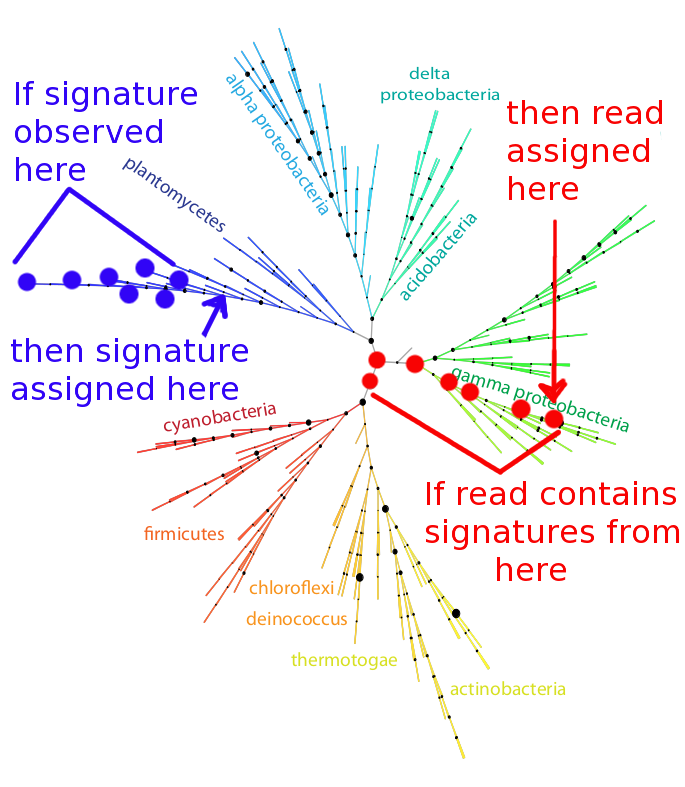
Illustration of the 402-node bacterial reference tree derived from an alignment of the RNA polymerase beta and beta prime subunits, with the signature-assignment algorithm illustrated on the left in blue, and read-placement algorithm illustrated on the right in red.
Phylogenetic placement can be confounded by the ubiquitous processes of gene duplication, domain swapping, and horizontal gene transfer, as well as the differing gene inventories of even closely related bacteria. By choosing a signature-by-signature placement on the phylogenetic tree, we are eliminating the ortholog-identification step from the phylogenetic profiling process. In essence, our approach replaces the question of gene sequence similarity with the question, “Where have these signature peptides been seen before?”. Since some signatures appear in dozens of organism, our decision to place the signature peptide close enough to the root of the tree to cover every observed instance of the signature can ve viewed as quite conservative. A specific phylogenetic assignment will only be made if no conflicting evidence is available, so observed phylogenetic signals represent self-consistency in our assumptions.
By selecting the 5% of 10-mer peptides in our 403 reference genomes, we have identified the 20 million peptides most-likely to appear in bacteria not in our reference set. In order to assign function to each signature peptide, we simply search example protein sequences for each of the signature peptides. The SEED classification [3] of protein function provides such lists for 1000 distinct classifications, as well as a hierarchical rollup to 28 different types of families. We were able to make functional assignments for 70% of our phylogenetically-derived signature peptides in this manner.
2.7. Sequedex’s outputs
In this section, we show an example of each type of Sequedex’s data being plotted.
Phylogenetic and functional profiles: Because each signature possesses both a phylogenetic and a functional assignment, it is possible to profile microbial communities on the basis of both phylogenetic and functional matches, where each read gets one count in the profile. By design, these profiles are not biased by the depth of sequencing, assembly, or the quality of annotation of reference genomes.
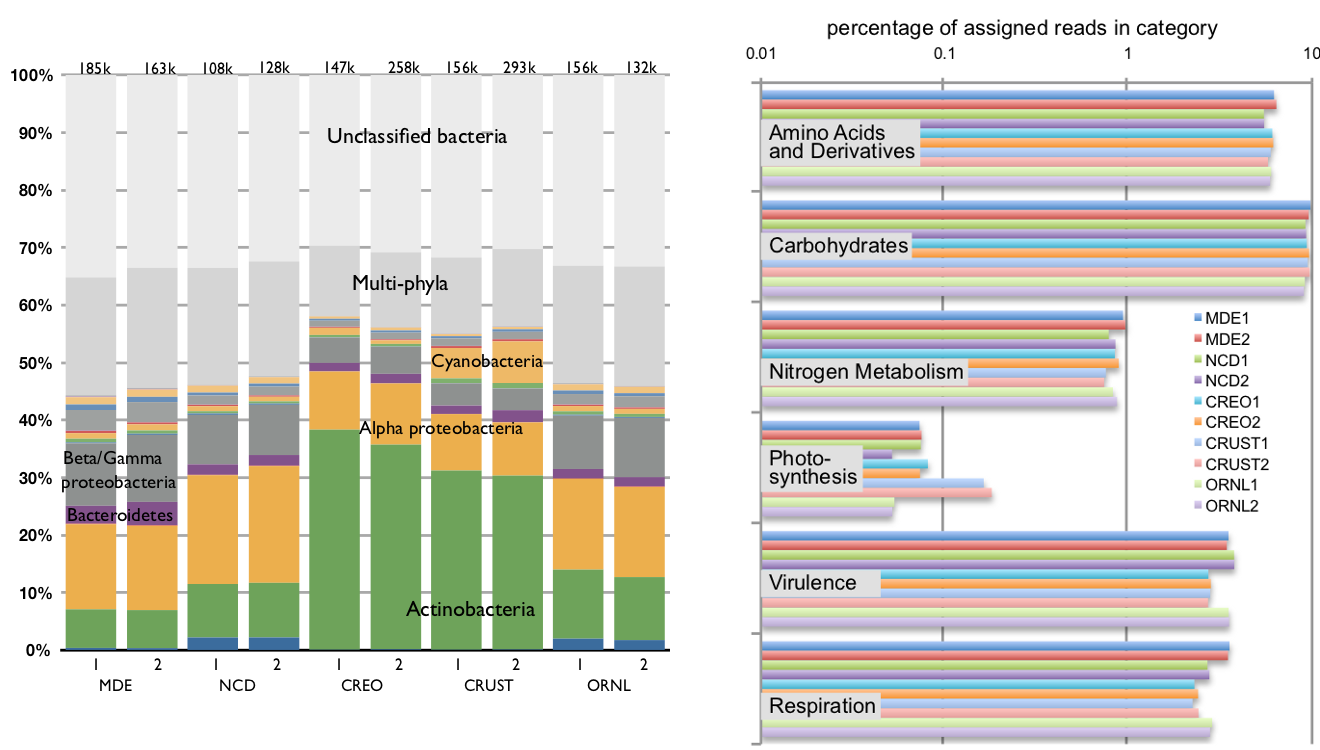
Sample rollups of (left) phylogenetic and (right) functional profiles of the ten metagenomic communities. The resolution and structure of the phylogenetic and functional classifications depend on the classification of the signature peptides. This calculation used the 402-node bacterial tree and 962-category SEED functional classification. This data set is the one discussed at length in Reference 2.1.
The reference tree used for the Bact403 data module (with node numbers
defined) can be downloaded in phyloxml or pdf
format. The functional categories are described in this
csv file.
Because possibility-space for 10-mer matches is so much larger than the number of signatures, the effect of sequencing errors will typically be to cause one or more signatures in a read to not be detected. Since this is a fairly benign mode of failure, quality scores not used by Sequedex at present.
‘Who does what?’ matrixes: By definition, every read recognized by Sequedex has a phylogenetic placement (although identification at the root node conveys no taxonomic information). Typically 70% of the identified reads are also given a functional assignment by Sequedex. As the above figure shows, it is frequently most convenient to visualize the phylogenetic profiles averaged over all functions and the functional assignments averaged across the phylogeny. In some cases, however, important information can be obtained by looking changes in the two-dimensional histogram across both phylogeny and function. We refer to this as the ‘Who does what?’ matrix, and an example where this is informative is an analysis of a dental carries transcriptome data set figure. Since the bact403 tree contains 403 nodes and the seed_0911 classification contains 961 categories, this matrix has a large number (~400,000) of categories, and is most useful with data sets containing 10s or 100s of million reads.
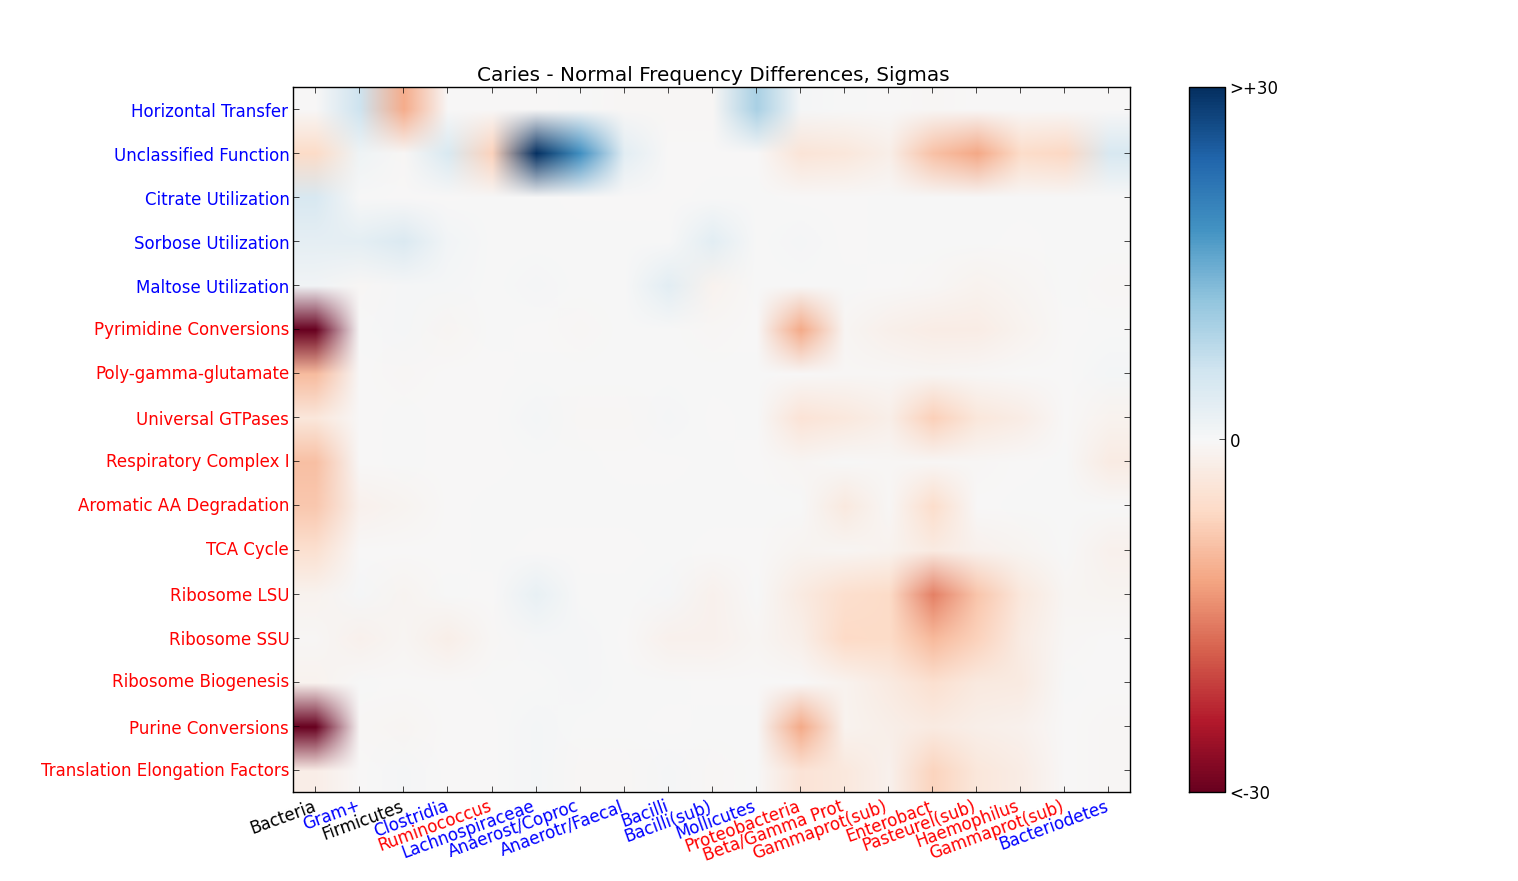
Heat map of changes in expression level of the oral microbiome between 18 patients with dental carries and 18 patients without dental carries broken down by phylogeny (x-axis) and function (y-axis). Blue spots indicate populations that are elevated in patients with dental carries, while red spots indicate populations that are higher in patients without carries. The intensity scale, shown in the inset, is the difference in average between the two populations in units of the average standard deviation within each population.
Annotated reads: While a great deal can be learned from the histograms of counts, further analysis of reads can provide targeted assemblies, precise taxonomic assignments, characterization of quasi-species and mixed populations, and provide specific sequences of enzymes or regulatory proteins for structural modeling or more detailed assessments of gene function. Traditional analysis techniques have been used to identify such reads, but analyses are prohibitively slow, especially since researchers typically do not know ahead of time which phylogenetic taxa are present and whether the depth of sequencing is high enough and the richness of the sample in the phylogenetic region of interest is low enough to enable assemblies to be made. An example of reads identified by both phylogeny and function being compared to reference sequences is shown in the figure below.
FIGURE - Cyanobacterial rubisco reads identified by Sequedex from (i) Sanger sequencing of Global Ocean Survey metagenomic samples, (ii) 454 sequencing of FACE sites soil metagenomic samples, and (iii) reference genes from Genbank, compared together in a multiple sequence alignment.
2.7.1. What is the specificity and sensitivity of Sequedex when matching bacterial genes and gene fragments from novel bacteria?
The sensitivity and specificity with which Sequedex classifies short
genomic fragments is determined by the signature list, phylogenetic
reference tree, and functional classification contained in the data
module. The Bact403 data module distributed with Sequedex was based
on 403 reference genomes and their inferred evolutionary history,
shown below and available here as a pdf.
Sequedex is comparable to BLASTX in sensitivity and specificity for matching bacterial genes from phylogenetically distinct organisms, and, and is intrinsically designed to provide conservative specificity when read-assignments are made to a phylogenetic tree. Because the signatures used for assignment by Sequedex are 30 base pairs in length, the method works nearly as well with short reads as long reads. We employ two validation strategies here: examination of matches to well-annotated but distantly-related organisms and analysis of draft genomes of novel soil bacteria.
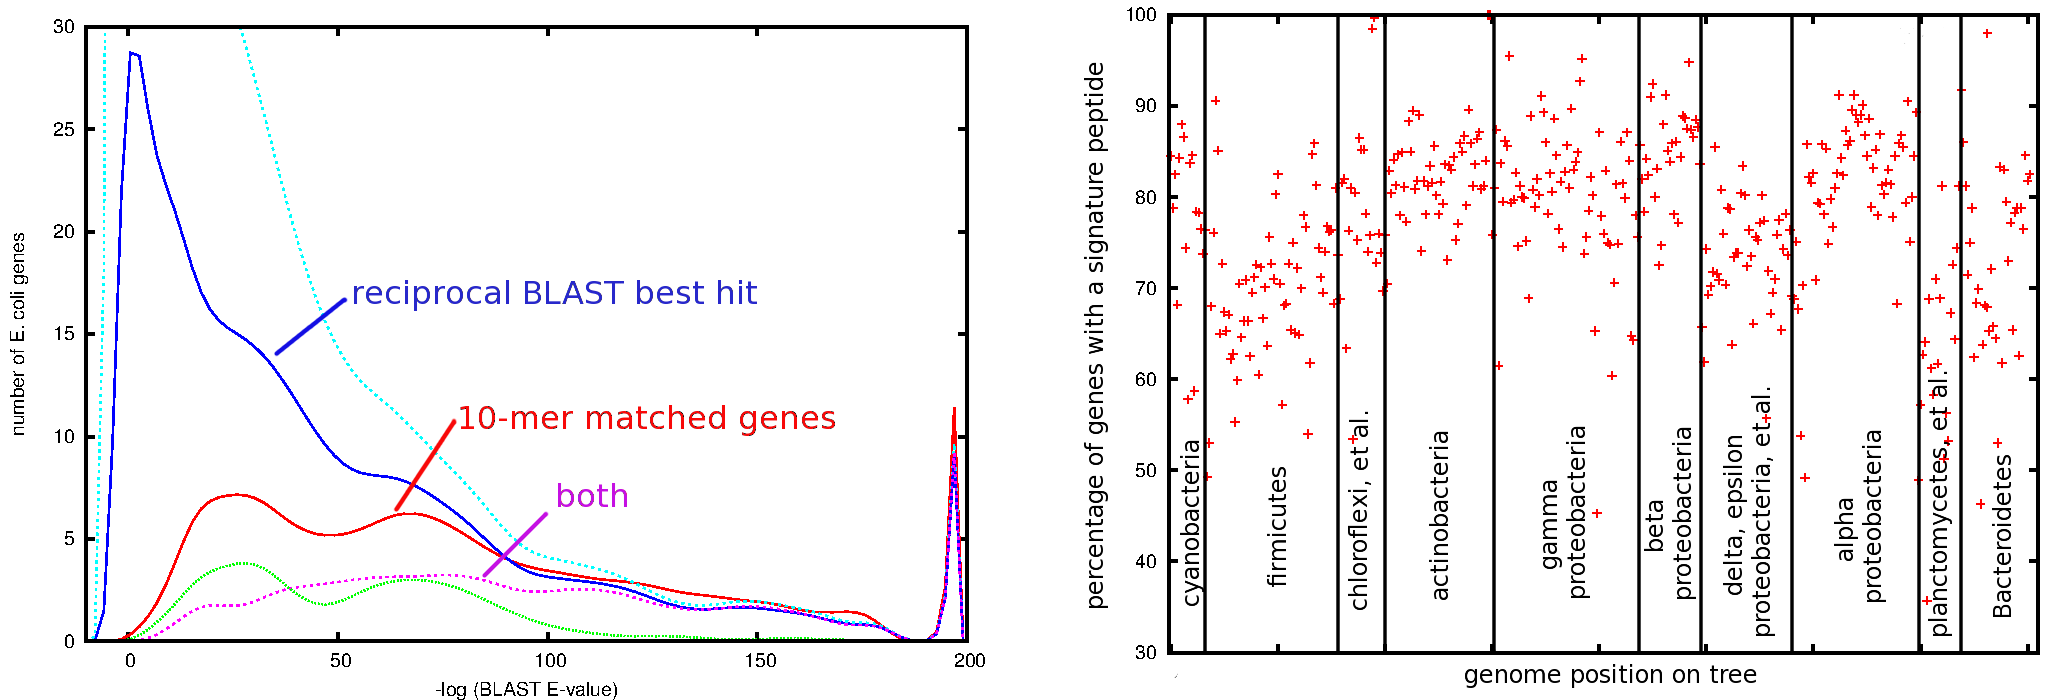
(left) Distribution of Protein BLAST scores (-log(E-value)) for various sets of E. coli genes scored against genes in the B. subtilis genome. At the top, in cyan, is the distribution of the best-match BLAST scores for each of the 4145 genes in the E. coli genome. 1461 of these are also reciprocal best hits of the B. subtilis genome against E. coli; the distribution of these scores is shown in dark blue. 746 distinct pairs of E. coli – B. subtilis genes are connected by one or more 10-mer matches; the distribution of BLAST scores for these matches is shown in red. In magenta is shown the distribution of BLAST scores for the 388 genes that are both reciprocal BLAST best hits and connected by one or more 10-mers. At the bottom of the plot, in green, is the distribution for genes with matching 10-mers and the word ‘transporter’ in either gene’s annotation. The peak at the right of the plot indicates the 37 pairs of genes given an E-value of ‘0.0’ by BLAST. (right) Fraction of genes containing at least one signature peptide in genomes across the 403 bacterial reference genomes. As described in the text, signature peptides are exact matches between genomes of different genera of length 10. The genomes are ordered along the x-axis according to their position in our bacterial phylogeny.
The use of solid patterns of amino acids to annotate the function of proteins is startling in both its simplicity and effectiveness, and its use goes back more than 25 years (see [4] and [5] as well as the prosite website at http://prosite.expasy.org/prosuser.html). If the reader has access to a command line (standard in Linux and Mac operating systems and available as Cygwin for Windows), a few simple commands will illustrate the point.:
mkdir bacteria
cd bacteria
wget ftp://ftp.ncbi.nih.gov/genomes/Bacteria/all.faa.tar.gz
tar -zxf all.faa.tar.gz
for i in `ls -1 |tr '\n' ' '`;do cat $i/*.faa > $i/all.p.fas;
    tr -d '\r\n' < $i/all.p.fas |tr '>' '\n' > $i/all.1; done
grep GADDY */all.1
grep GG.R.GEME */all.1
If wget is not installed on your system, simply download the file by some other means and place it alone in a directory. In the case of GADDY, tens of thousands of response regulators will be identified. In the case of GG.R.GEME, you will identify the RNA polymerase in all of the bacterial genomes. Approximately 20 percent of the proteins containing the 5-letter GADDY motif are not response regulators, but the seven letters of GG.R.GEME has 100 percent specificity. Given these observation, it is perhaps not surprising that 10 letter motifs (much longer than anything in prosite) have a very high degree of specificity, as indicated when comparing the distribution of BLAST scores of 10-mer - matched genes in E. coli and B. subtilus.
Given the high specificity of 10-mer peptide exact matches, it is then natural to question the sensitivity of 10-mer peptides in searching novel organisms. The right panel of the figure above shows that an average of 80% of the genes in our one-per-genera set of 403 representative bacteria contain a shared amino acid 10-mer with another organism. Both logic and closer inspection of the data reveal that the genes not sharing an amino acid 10-mer are not the well-understood proteins, and are not particularly robust choices for assigning phylogeny to a metagenomic read. Given that modern sequencers are capable of producing 100 million reads in a single sample, it seems prudent to discard the 20% of reads coding for such genes when trying to phylogenetically profile a microbial community. We are decreasing systematic bias at the cost of a slight increase in counting noise.
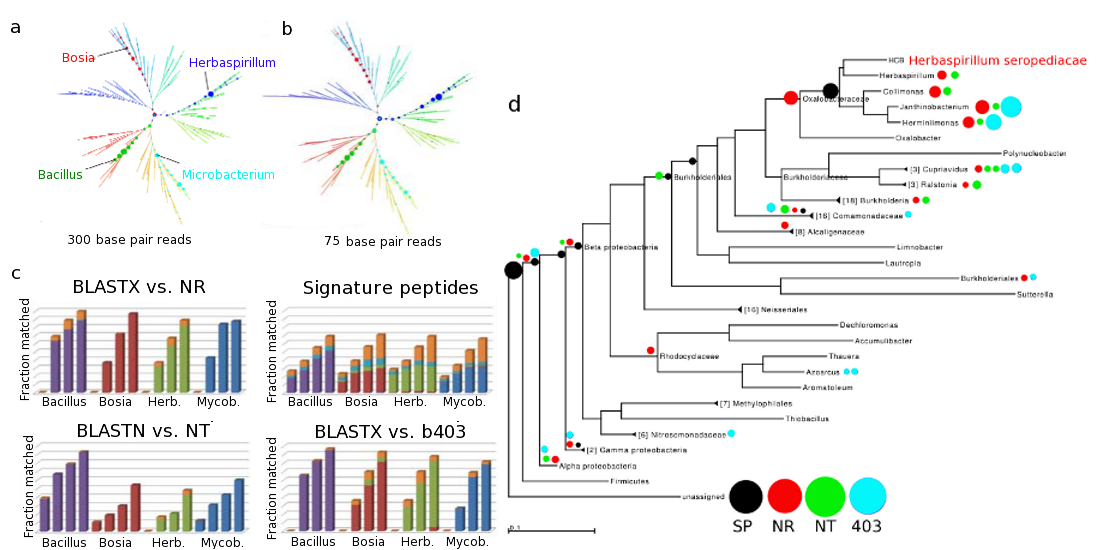
Sensitivity of and specificity of simulated reads from draft soil genomes simulated reads were constructed using MetaSim from genomes of four soil bacteria. Herbaspirillum seropedicae and Bacillus mojavensis are species from genera represented in the BLAST databases NR and NT as well as our signature peptide database (SP). Microbacterium trichotecenolytcum represents a genus found in NR and NT but not in SP. Bosea thiooxidans is from a genus not found in any of the three. (a) Specificity of placement of simulated reads on the reference tree using our method. (b) Placement of 75-bp reads using our method. (c) Comparison of sensitivity of our method (top right panel) and MEGAN using three different BLAST databases: BLASTX and NR (top left) BLASTN and NT (bottom left), and BLASTX against the same genomes used in SP (bottom right). Simulated read lengths of 75, 150, 300, and 600 bp were used for each of the four genomes in each of the four panels. Colors indicate specificity of placement, with gold indicating non-specific placement near the root node in each case. (d) Details of specificity of placement of simulated 150-bp Herbaspirillium seropediacae for the 4 methods: our method (black), MEGAN4 with BLASTX against NR (red), MEGAN4 with BLASTN against NT (green), and MEGAN4 with BLASTX against the same genomes used in SP (cyan).
Most methods have a higher sensitivity when challenged with data closely related to that in the reference database used to construct the method. Hence, it is prudent to also check the sensitivity of Sequedex on novel organisms. In the next figure, we assess the sensitivity of Sequendex on synthetic reads derived from the 99% complete draft genomes of four soil bacteria cultured from a desert soil microbial community. On the left, we assess the read-length dependence of Sequedex analysis of novel genomic data and compare the results to three established methods. On the right, we look in more detail at how recruitment to nodes of a phylogenetic tree compares to the more typical method of recruiting to the leaves of a tree, with some post processing.
The relative insensitivity of the phylogenetic profile as the length of genomic fragment increases from 75 base pairs to 300 base pairs is visible in the top panel for the four organisms, and is one of the reasons Sequedex can be used to reliably compare data from different studies and sequencing platforms. Although the profile does not change with read length, panel (c) shows the sensitivity with which Sequedex identifies reads in comparison with three other methods for each of the four organisms and as a function of read length (75, 150, 300, and 600 base pairs). We do not attempt to characterize the phylogenetic specificity of assignment in this figure.
To better-understand how the different methods ascribe phylogenetic placement of the synthetic organisms, we present these results for Herbaspirilium seropediacae on a phylogenetic tree in panel (d), on the right side of the figure, averaging over the four read lengths. Although Herbaspirlium is on the tree (placed on the basis of its RNA polymerase gene), it was not in any of the reference databases. It is immediately evident that the BLAST-based methods, when run through MEGAN, all place the vast majority of reads overly-specifically, with a small fraction incorrectly assigned to leaves of the tree in the wrong family of bacteria. Sequedex, by contrast, assigns only about half of the reads to the appropriate node of the phylogenetic tree, where Herbaspirilium joins the phylogenetic tree. Rather than erroneously assigning the reads, Sequedex chooses to assign them simply as ‘bacteria’ or ‘beta proteobacteria’. While increasing the counting noise in the phylogenetic profile somewhat, this behavior makes the comparison of phylogenetic profiles much less noisy, as the comparisons will be based only on signature peptides which have never been seen outside the specific location on the tree where the assignment is made.
2.7.2. How can Sequedex output be validated and understood?
Sequedex represents a novel method for classifying genomic data, serving a comparable roll to BLAST and defining protein families with hidden Markov Models. Although building off of the idea behind such well-established algorithms as PROSITE and BLOCKS, Sequedex leverages modern indexing and text-processing alogrithms, the relatively complete set of reference genomes, and an algorithmic incorporation of inferred phylogeny to produce a qualitative improvement in both the speed and robustness of genomic classification. Since it represents a novel algorithm, it will require a great deal of empirical application for users to gain a ‘feel’ for how to interpret the output of signature based analysis and how it handles the curve balls practical application throws its way.
In later sections, we show the user how to validate with his or her own data. To this end, we see several ways Sequedex can be validated and understood:
- Compare results from analysis of files with nucleotide sequences of each gene from completed genomes of various organisms (ffn files)
- Compare results from analysis of individual genes from well-annotated organisms
- Generate and compare synthetic data
- Compare analysis of a variety of microbial communitites
- Output, assemble, align, and classify reads.
2.7.3. How will Sequedex be improved?
- Updated and improved trees (eukaryotes, mitochondria, plastids, archaea, viruses, phages, species-level resolution).
- Better functional classifications (eukaryotes, improved definitions of functional classifications, better annotation of gene function).
- Curation of signature lists to eliminate low complexity signatures, signatures that do not connect orthologs, and mis-called genes.
- Improve the output of peptide fragments on the basis of phylogeny and function, both unaligned and aligned to reference proteins. This will be useful both for assembly, enzyme mining, and more accurate phylogenetic assignments.
- Differentiate deeply branching signatures resulting from conservation and horizontal gene transfer.
- Compare metagenome richness and diversity on the basis of metagenomic data, with only weak dependency on the reference database.
- Identify and annotate signatures on the basis of metagenomic data, with only weak dependency on the reference database.
Sequedex is designed to operate with different signature databases. At present the only databases for public release are the one-per-genus bacterial tree: bact404, the one-per-species tree of life, Life2550, and the one-per-species viral tree, virus1252. This bact404 database was used to produce the data in the paper. Please contact the authors if you have unique access to data that could make use of the broader databases and if you are interested in collaborating on the initial papers.
| [1] | Berendzen, J., WJ Bruno, JD Cohn, NW Hengartner, CR Kuske, BH McMahon, MA Wolinsky, G Xie, “Rapid phylogenetic and functional classification of short genomic fragments with signature Peptides”, BMC Research Notes, August, 2012 (http://www.biomedcentral.com/1756-0500/5/460/abstract) |
| [2] | http://www.rdmag.com/Awards/Rd-100-Awards/2012/08/DNA-Defined-By-Ancestry/ |
| [3] | http://www.theseed.org |
| [4] | Doolittle R.F. (In) Of URFs and ORFs: a primer on how to analyze derived amino acid sequences., University Science Books, Mill Valley, California, (1986). |
| [5] | Lesk A.M. (In) Computational Molecular Biology, Lesk A.M., Ed., pp17-26, Oxford University Press, Oxford (1988). |